Every finance team measures the accuracy of its numbers. Almost none measure the speed. There is a number sitting between every question a leader asks and the moment a credible answer exists. Call it decision latency.
In most project-based businesses it runs from a few hours to a few days, and unlike forecast error or close timing, nobody tracks it. It hides because it produces no line item. A margin that erodes for two extra months before anyone notices does not announce itself as a latency problem. It just shows up as a worse quarter.
This is worth measuring, because decision latency is quietly one of the most expensive numbers a finance organization carries. Here is how to think about it, what it actually costs, and how to bring it down.
What decision latency is made of
Decision latency has two parts, and they are wildly unequal. The first is assembly: pulling revenue from one system, cost actuals from another, the project and resourcing detail from a third, reconciling the estimate at completion against the frozen forecast, and getting it all into a single view. The second is analysis: reading that view and deciding what it means.
For most teams, assembly is eighty to ninety percent of the elapsed time. The analysis itself, the part that requires a finance leader’s judgment, often takes under an hour once the data is clean. The three-day answer is almost never three days of thinking. It is three days of gathering, and one hour of insight at the end.
That ratio is the whole problem. The expensive, scarce resource is judgment, and the process spends nearly all its time before judgment can even begin.
The four ways delay costs money
The cost of decision latency is not abstract. It falls into four buckets, and each one is measurable if you look.
Margin caught late.
A contract that starts drifting against forecast in month two but surfaces in a quarterly variance review has eroded for a full quarter before anyone could act. The cost of delay is not the size of the gap. It is the months of erosion that an earlier answer would have arrested. On a single mid-size program, that difference is often six figures.
Resources left idle.
Underutilized people in the forecast are a cost the moment they are not redeployed.
When it takes a week to spot which resources are slack and which programs are short, the redeployment happens a week late, every week. Multiply a small utilization gap across a portfolio and a full quarter, and the number stops being small.
Forecasts that age out.
A forecast is only useful while it can still change a decision. When the analysis behind it takes days, the forecast informing this month’s staffing or spend decision is often describing last month’s reality. Slow analysis does not just delay answers, it quietly lowers the quality of every decision downstream of the forecast.
Curiosity that gets rationed.
This is the largest cost and the hardest to see. When answers are expensive to produce, people stop asking the small questions, the ones that catch problems early. A leader who would happily check ten contracts checks the two that justify the effort. The other eight go unexamined until one becomes a problem. Every unasked question is a risk that compounds in the dark.
How to measure your own latency
The diagnostic is simple, and worth running before any tooling conversation. Take the last five questions your finance team fielded from leadership or the board. For each, write down two numbers: the elapsed time from question to credible answer, and an honest estimate of how much of that was assembly versus analysis.
Then ask a harder question: how many useful questions did people decide not to ask that week because the answer was not worth the effort to produce. The first set of numbers tells you your latency. The second tells you its true cost, because the rationed questions are where the early warnings were hiding.
Most teams are surprised by how lopsided the assembly-to-analysis ratio is, and how long the list of unasked questions gets once they start writing it down.
The lever that actually moves it
Once latency is broken into assembly and analysis, the fix becomes obvious.
Speeding up the analysis is pointless, because the analysis was never slow. The lever is assembly. Collapse the time it takes to get from question to clean, connected view, and latency falls toward the length of the question itself.
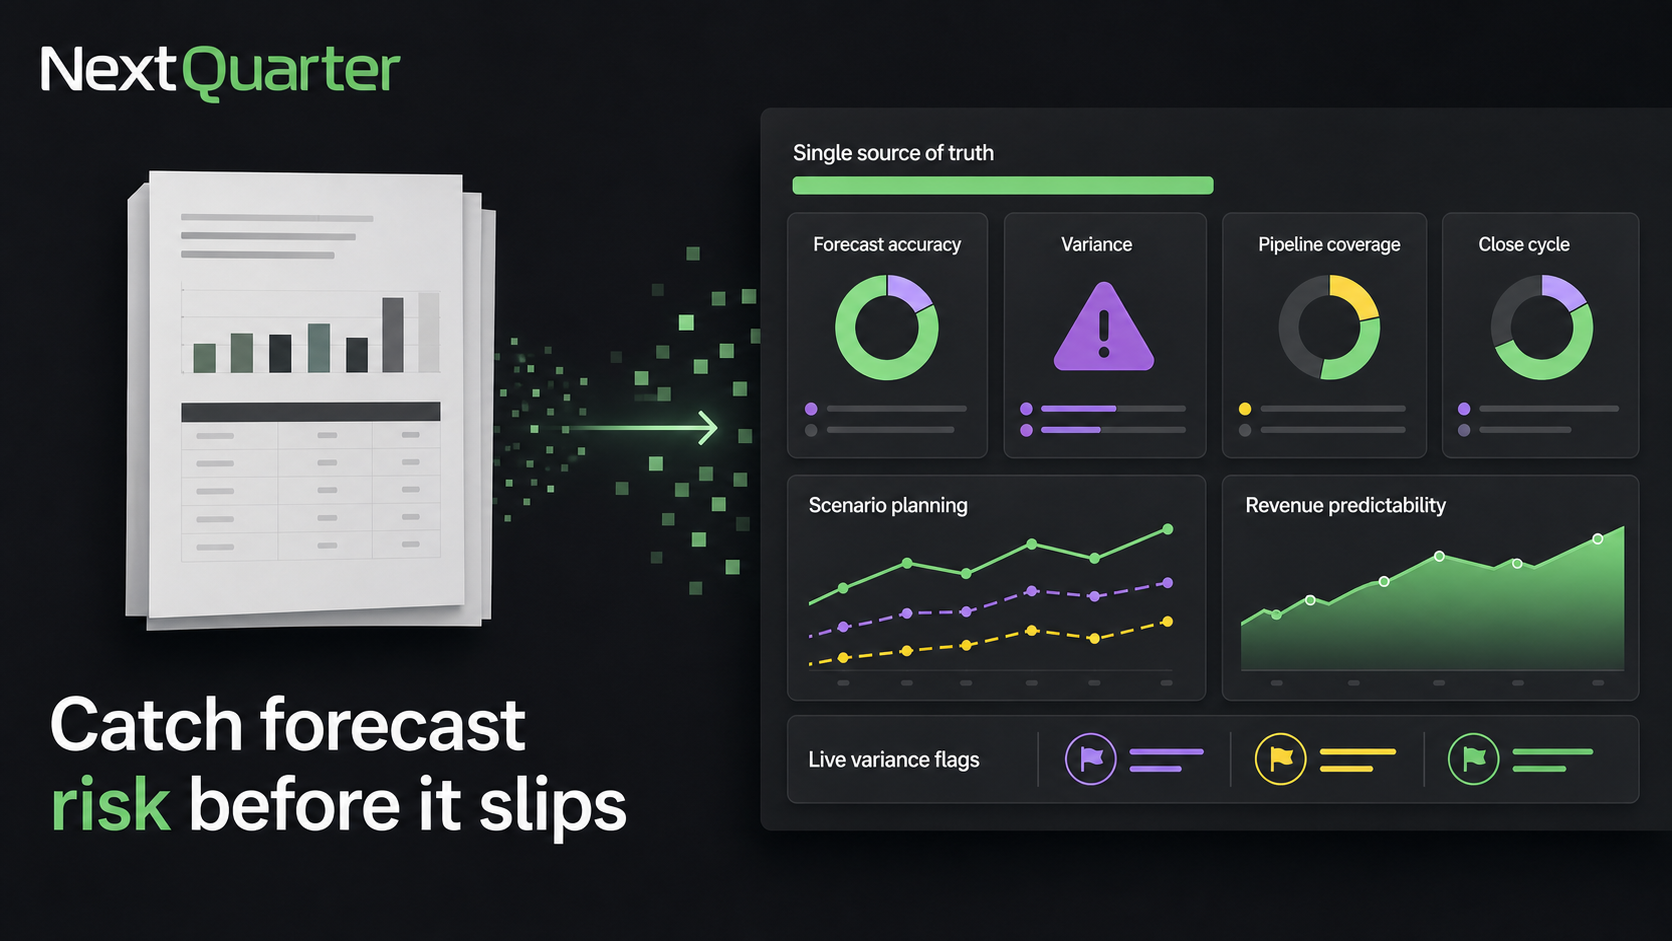
That is the premise behind NQ Assist. It connects revenue, finance, and project management data in one place and lets a finance leader ask a question in plain language, then does the executive-level analysis and returns the answer rather than a raw table to interpret.
Ask how this quarter compares to last on revenue and margin, and the response comes back in seconds: revenue down from $88.7M to $79.1M, gross margin softened to 38.3%, net margin to 12.3%, with the specific contracts carrying the decline already flagged by severity and ranked against the frozen forecast.
The bridge from contract revenue to net profit is already drawn. The assembly is gone, so the only time left is the time to decide what to do.
The strategic shift matters more than the speed. When assembly drops to near zero, curiosity stops being rationed. The leader who used to check two contracts checks all of them, catches the drift in month two instead of the quarterly review, spots the idle resource while there is still time to move it. Finance moves from explaining the last quarter to steering the current one. That is what low latency buys: not faster reports, but earlier decisions.
The number worth tracking next quarter
Accuracy will always matter. But a perfectly accurate answer that arrives after the decision has been made is worth nothing, and finance teams rarely account for that. A slightly faster answer that arrives while the quarter is still live is often worth more than a flawless one delivered too late.
Start treating decision latency as a metric. Measure it, watch where the time actually goes, and attack the assembly that consumes most of it. The teams that do this are not producing better-looking reports. They are making earlier, cheaper decisions than the competitors still waiting three days for an answer
FREE WORKSHEET
The Decision Latency Self-Audit
INSIDE: Last 5 questions | Assembly vs. analysis $ | cost of delay | Unasked questions
ONE-PAGE WORKSHEET · PDF
The Decision Latency Self-Audit
WHAT IT DOES
- Scores the last five questions your team answered
- Separates assembly time from analysis time
- Puts a dollar figure on the delay — including the
questions that never got asked
Take the Next Step
Stop waiting three days for an answer. See NQ Assist build a decision-ready finance
report from your own revenue, cost, and project data in seconds.